
Variance & Three Point Strategy
How variance can affect NBA team strategy

Code can be found here.
Ever since basketball analytics have made their way into the mainstream, much focus has been put on the three-point shot and its ability to shift the momentum of a game. The three-pointer is a high-risk/high-reward prospect: you trade in the higher probability of making a two-pointer for the potential extra point.
Three Pointers and Variance
Over the course of several possessions, a team’s strategy (in this case how often they decide to shoot a three-pointer) can affect its scoring distribution. Teams can potentially take advantage of this by calibrating their three-point shooting frequency based on their situation.
For example, consider a team’s performance over the course of 20 shot attempts. Using the binomial distribution, I’ve plotted the distribution of points scored for two different scenarios, one with a high number of three-point attempts and one with very few. The histogram with more three-point attempts has fatter tails. This means it’s more likely that the team scores very many or very few points. I assumed that the probability of making a two-pointer is 54.5% which is the league average. The probability of making a three-pointer is 36.3%, which would make the effective field goal percentage equal for both types of shots. The league’s overall three-point percentage in 2024 was 36.7%.
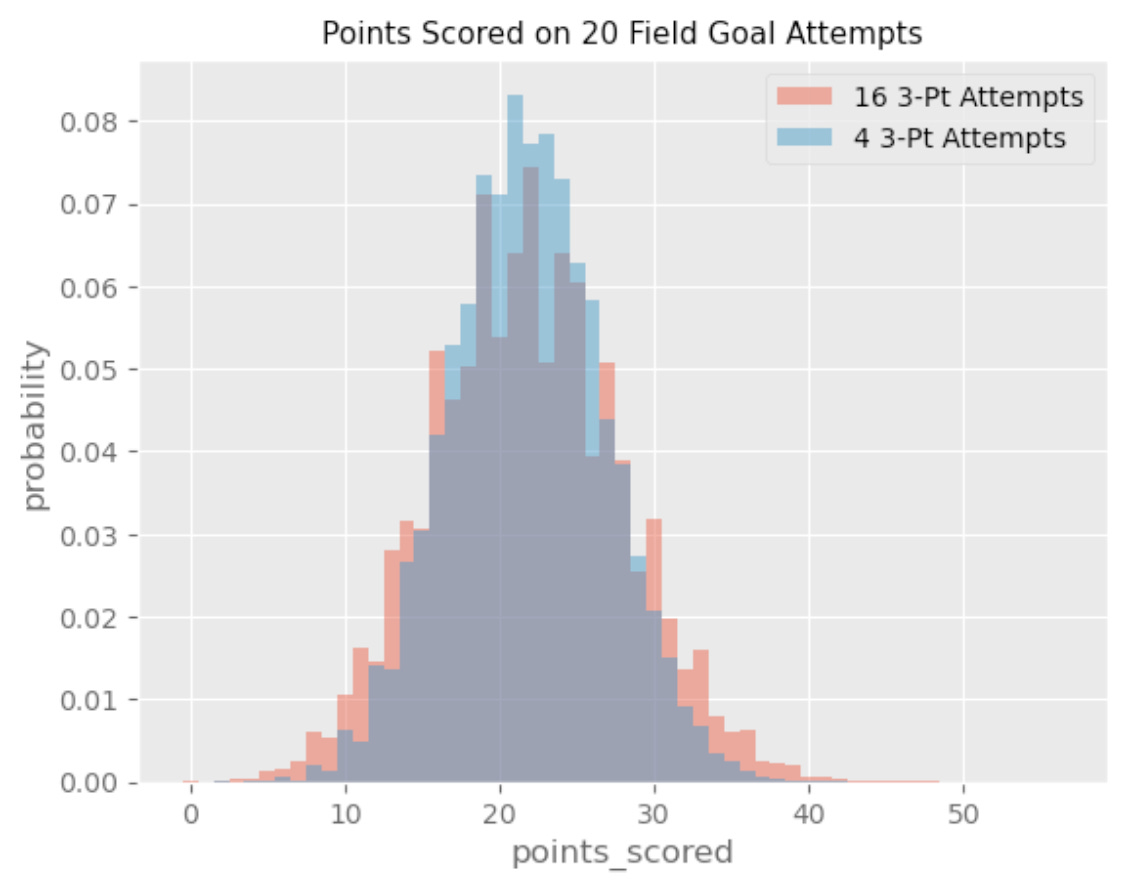
A high-variance strategy may be useful when a team is down. With a lot of ground to makeup, you need to score a lot of points in limited shot attempts. The risk of missing a lot of shots doesn’t really matter. Outside of the In-season tournament, a 40 point loss counts the same as a two-point loss. So a team that’s down significantly may want to focus on fattening its right tail. Likewise, a team that’s up by a lot would want a lower variance strategy. Fatter tails hurt them because that increases the chances that they score very few points, leaving the door open for the other team.
How does the score actually affect team strategy?
I wanted to see how teams actually respond to the score when deciding which kind of shot to take. So I pulled NBA regular season play-by-play data starting from the 2015-2016 season. In total, there were 1,024,689 field goals taken.
We can start by visualizing how often teams shoot three-pointers as a function of their score margin (the difference between your team’s score and the opponents). A positive score margin means that your team is up, and a negative one means that your team is down.
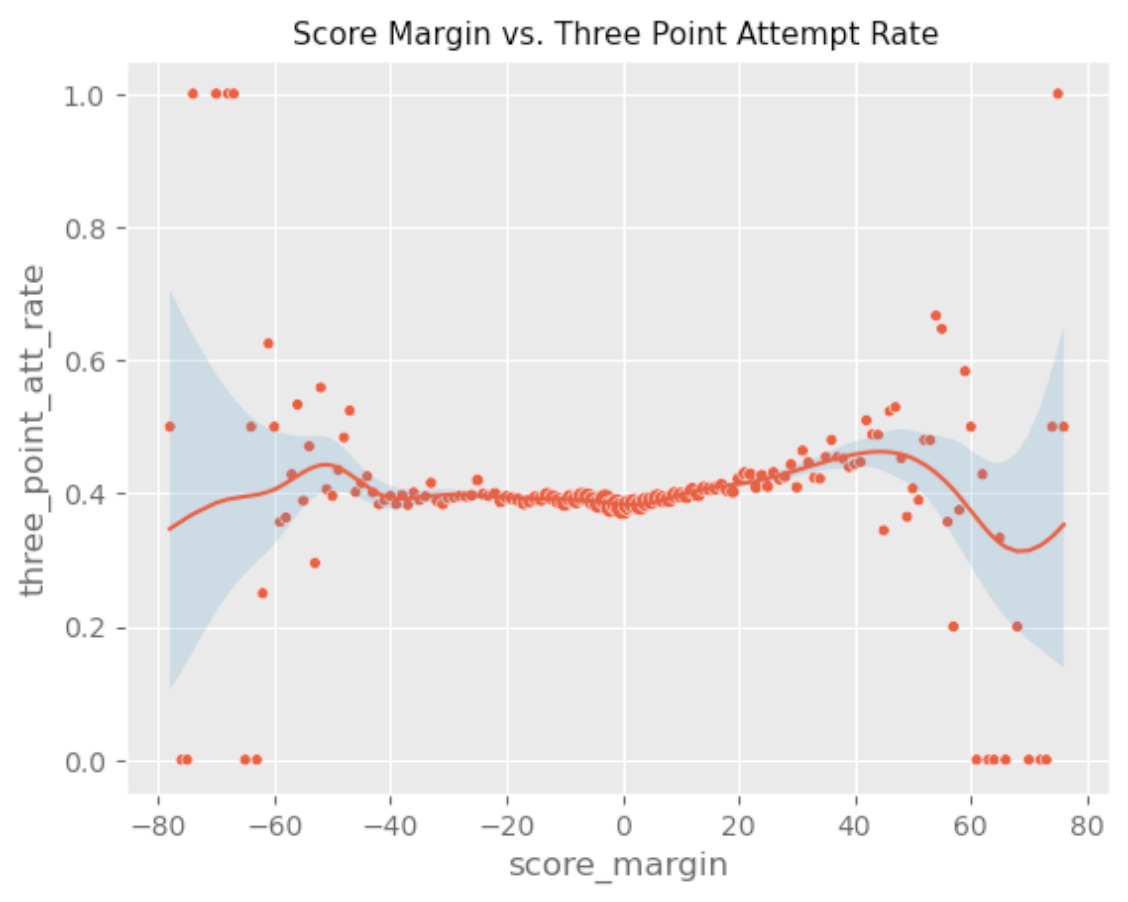
This scatter plot doesn’t show what I originally expected. If anything, it seems like teams that are up by a lot are actually more likely to shoot three-pointers. But the trend isn’t clear. Although this was a good starting point, it doesn’t take into account where in the game we are. A 20 point lead in the first quarter is very different from a 20 point lead in the 4th.
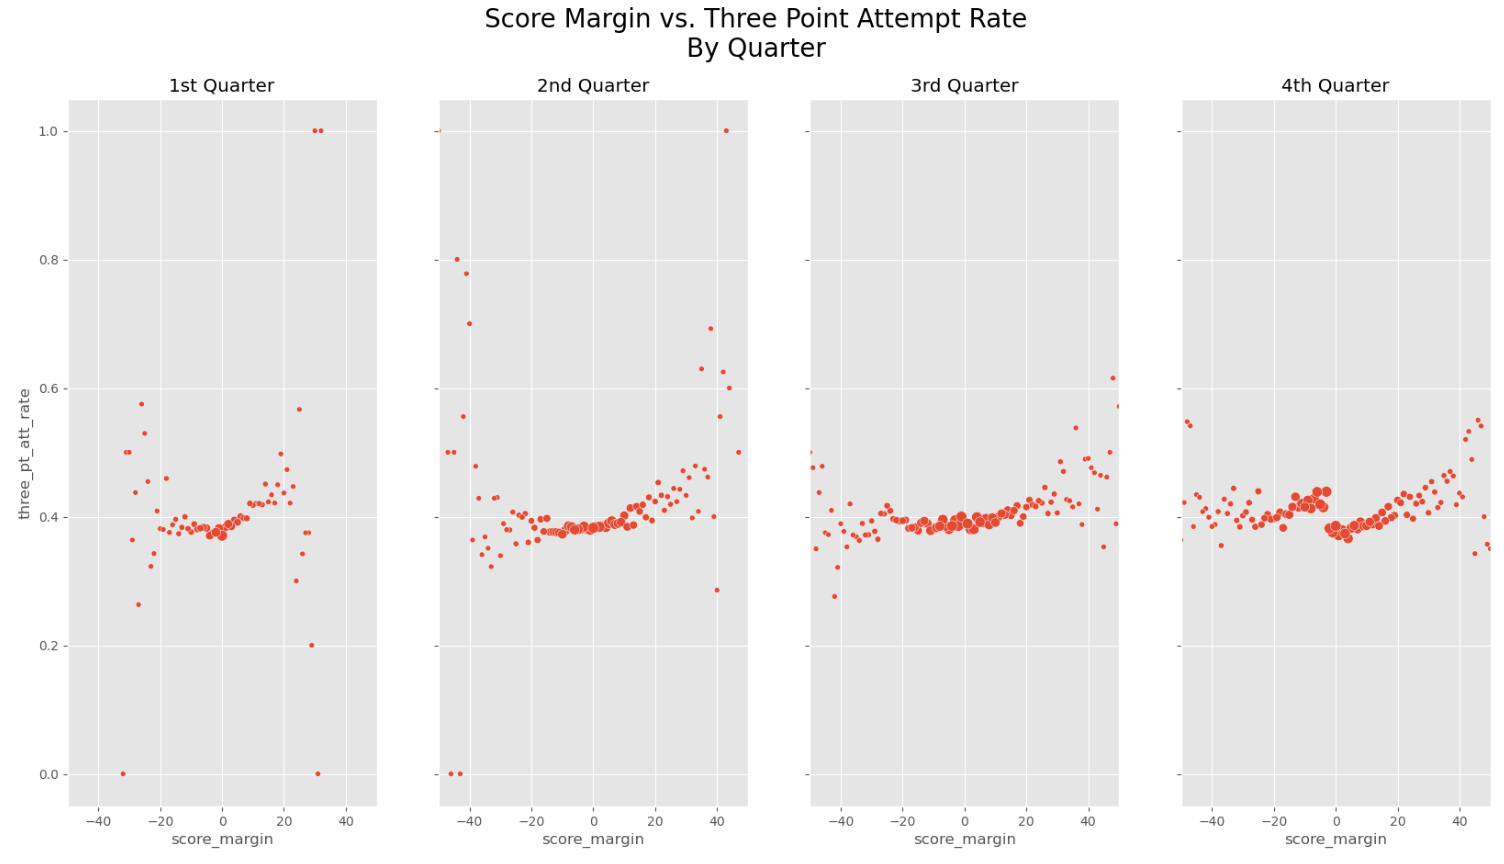
Now, the trends have become more clear, and we can see some interesting patterns emerge. The most obvious one is that the 4th quarter is distinct from the rest. In the first three quarters, it seems like there is a clear positive correlation between score margin and three-point attempt rate. That’s also true in the 4th quarter, but there is a significant dropoff at a certain point. That point happens to be when the score margin goes from -3 to -2.
I took a closer look at the 4th quarter to see if this pattern holds during the entire period. The scatterplots below show team three-point attempt rates at different time intervals in the 4th quarter. Dots that are to the left of the dotted line are where teams are losing by 3 or more.
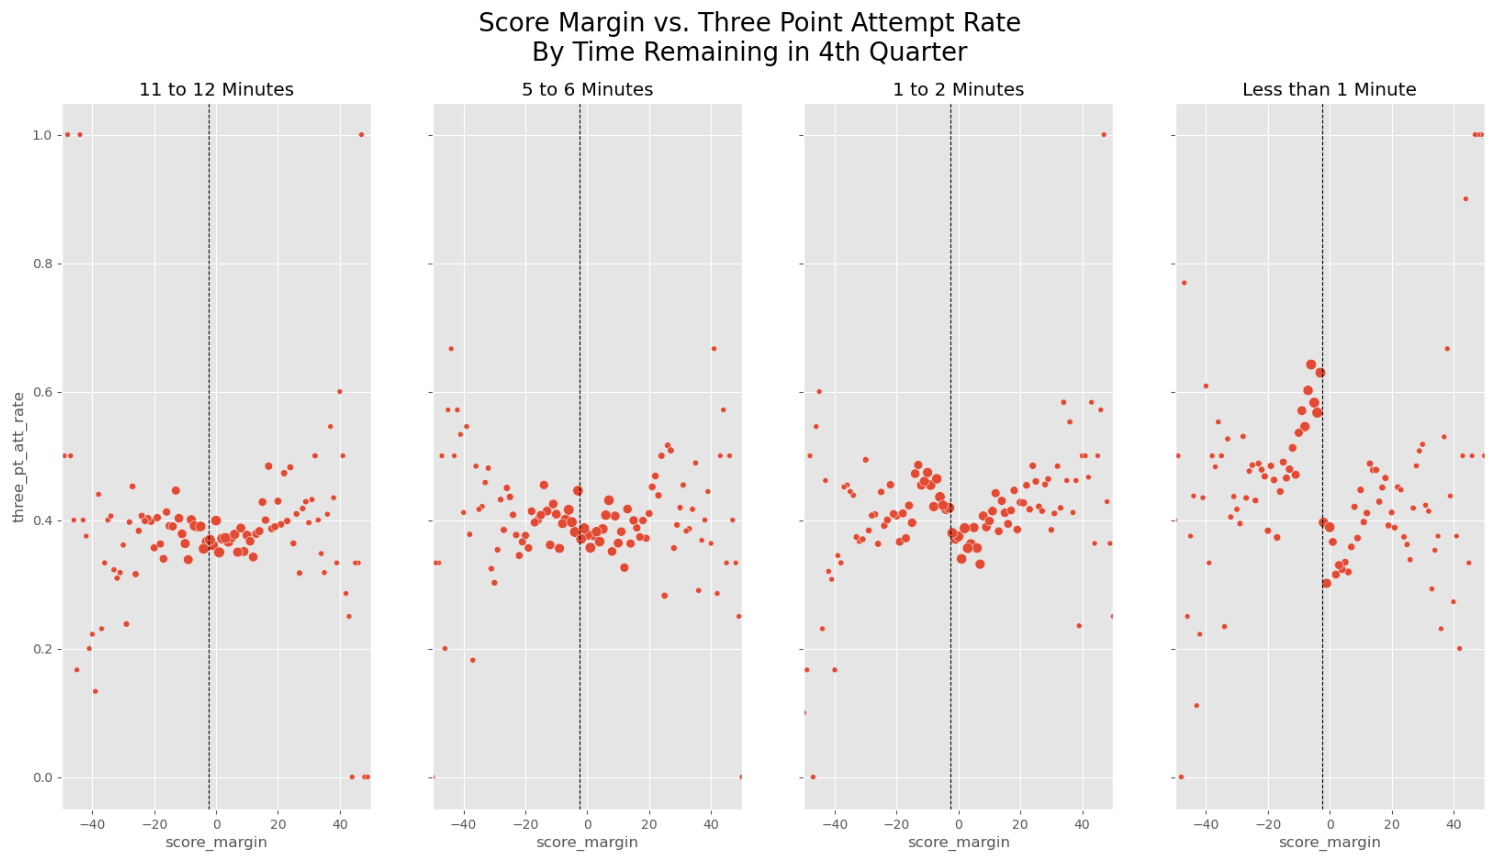
The dropoff becomes clearer and larger as time dwindles. My best explanation for the above would be something like this:
For most of the game, the increased variance isn’t worth the loss of efficiency a team might gain by changing their playstyle. This would explain why the slopes in the first three quarters aren’t negative.
Teams that are up may shoot more three-pointers because of momentum. Conventional wisdom would say that when a team/player is “feeling good”, jumpshots tend to be easier to hit.
At some point in the fourth quarter, teams become more sensitive to the score since there are fewer possessions left and variance matters more. A team that is down will shoot more and more threes until they get to within striking distance. Once they are within 2 points, they become less likely to shoot threes since they don’t need one to tie the game up.
Notes:
The positive slopes in the first three quarters remain when you control for team.
In the first quarter, there seems to be a bit of a dip when the score margin is -3. I don’t have a good explanation for why that dip exists in the first quarter but not in the second or third.
How does the three-point dropoff change during the 4th quarter?
We can try to quantify the dropoff in three-point attempt rate as a function of the time remaining in the game. Firstly, we can visualize it by plotting three-point attempt rates when teams are within a few points of being down three. In the scatterplot below, the blue dots represent shots where the offense is down by 3 to 5 points. The red dots represent shots where the game is tied or the offense is down by 1 or 2 points.
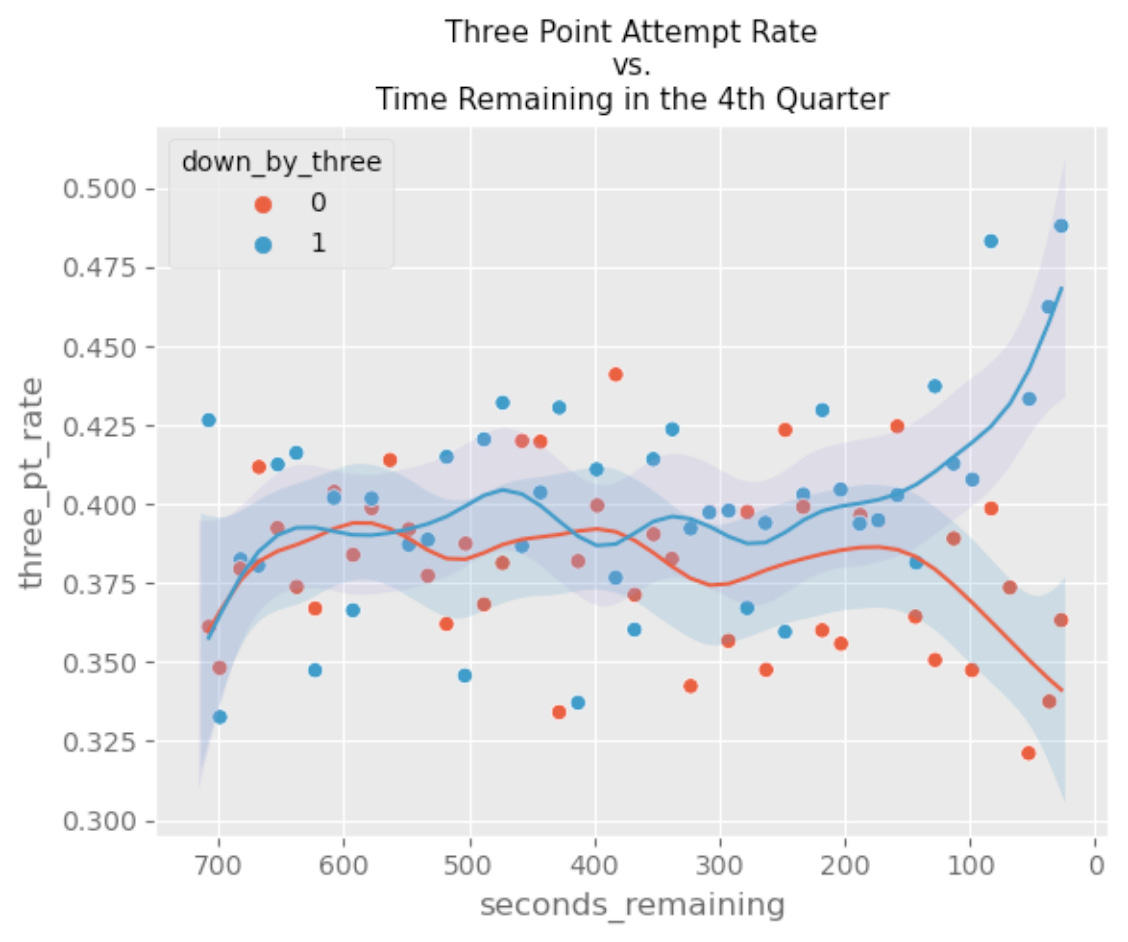
For most of the quarter, there isn’t a significant difference between the two groups, but in the last few minutes, a gap does appear and gets wider as time elapses.
To get a more rigorous estimate of this difference, I fit a Generalized Additive Model (GAM) to the data. The model is structured as follows:

Where:
P(three_pointer) is the probability that a given field goal attempt will be a three-pointer
β0 is the intercept
f1, f2, f3, and f4 are smooth functions of the following covariates:
x1: score_margin
x2: seconds_remaining_in_game
x3: A score/time interaction term defined by: score_margin ⋅ (720. - seconds_remaining)
x4: I(score_margin ≤ -3) ⋅ seconds_remaining
I excluded all shots taken within the final 24 seconds. Since the offensive team isn’t guaranteed another shot, there are so many specific factors that may drastically affect what kind of shot ends up being taken. After filtering, there were 235,318 4th quarter field goals left in the dataset.
Below are the partial dependence plots for each of the covariates in the model.
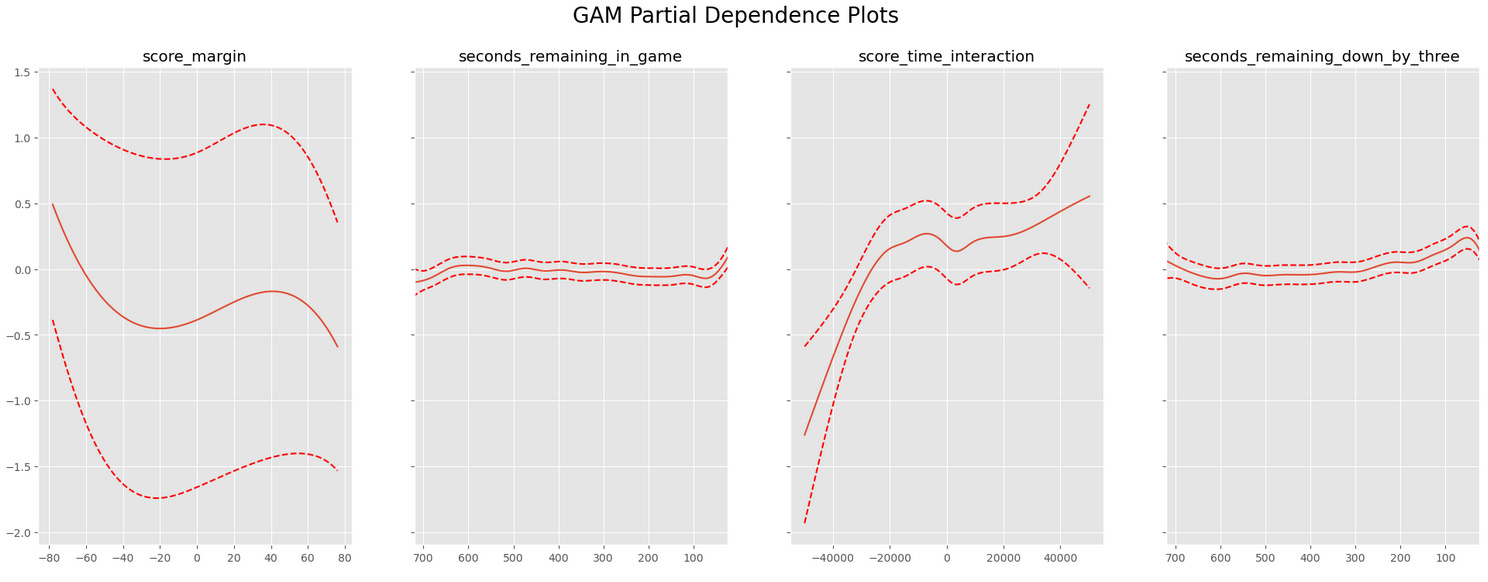
Since seconds_remaining_down_by_three is the variable of interest here, its partial dependence plot is shown below. The y-axis represents the delta: the estimated jump in log odds of three-point attempt rate that a team experiences from being down by three or more.
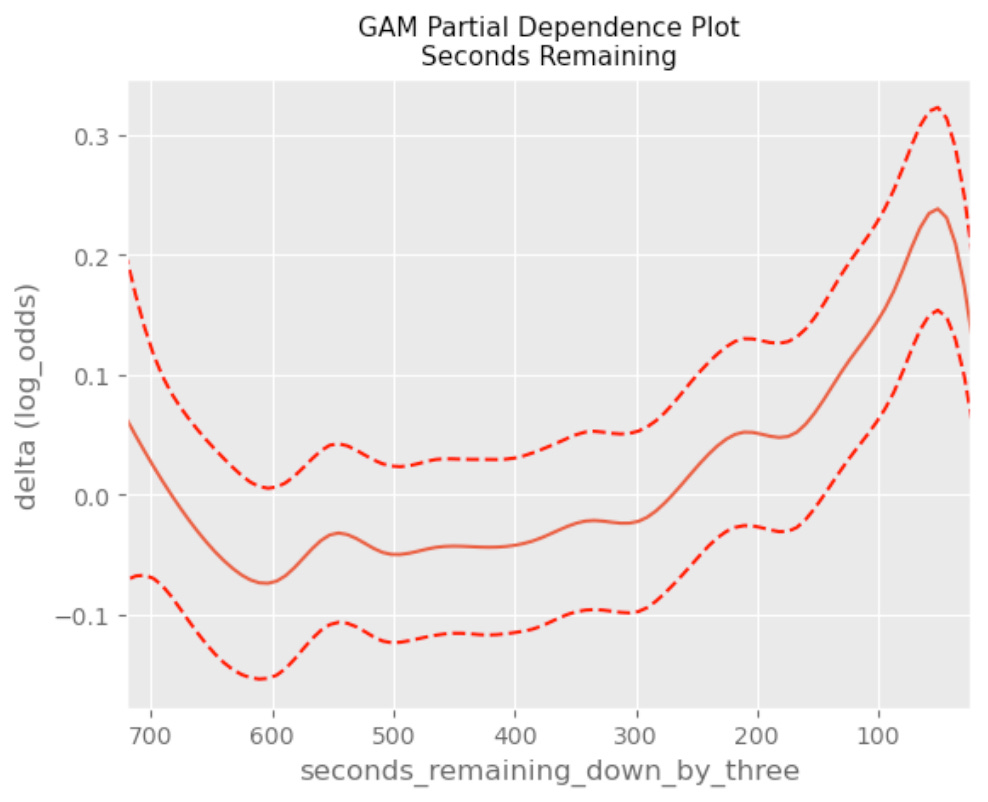
As we saw before, the difference doesn’t rise above 0 until the last few minutes of the quarter. 0 is in the confidence interval until about 150 seconds (2 minutes 30 seconds) left in the game.
Final Thoughts
Teams likely value “playing their game” rather than trying to take advantage of variance until the last few minutes of the game.
I used -3 as a hard cutoff for when a team’s 3-point attempt rate drops off, but that may not always be the case. For example, depending on the situation, a team might be very likely to shoot a three-pointer when down 2 in order to go up. An instrumental variable analysis would normally be a good way to address that problem, but since the change in strategy is unobserved, that route isn’t possible. A Bayesian approach may be able to address that problem.
Here, I only addressed three-point shooting as a potential change in strategy, but there are others. For example, a team that is down by a lot might try to speed the game up to maximize the number of possessions and affect variance that way.