


Measuring the Stability of The Four Factors

Code can be found here.
One way to measure a basketball team's performance is by breaking it down into a few key metrics called The Four Factors. Those factors are:
Effective Field Goal Percentage: Measures shooting ability while adjusting for the extra value of 3-pointers
Offensive Rebounding Rate: The percentage of available offensive rebounds that a team grabs
Turnover Rate: The percentage of possessions that end in a turnover
Free Throw Rate: (Free Throws Made) / (Field Goals Attempted). A measure of how often teams get to the line and make their free throws
When using any metric to evaluate performance, it's important to keep in mind how likely it is for that metric to be representative of the team's skill, rather than random variation or "luck". We know that random variation plays a crucial part in a team's success. Even Steph Curry has unpredictable bad shooting nights. But how can we measure that?
One simple method that is commonly used in sports analytics is to take two separate time periods, measure the statistic in question for both periods, and find the correlation between the two.
Here I took NBA regular season data going back to 2012-13. I excluded 2020 and 2021 since fewer games were played in those years. I separated the data by half of the year - each team's first 41 games are in one half, and the last 41 are in the other half - and calculated each team’s four factors for each half on both offense and defense. So in total, we had 300 observations, one for each team over those 10 seasons. We can look to see how strongly correlated the two halves are.
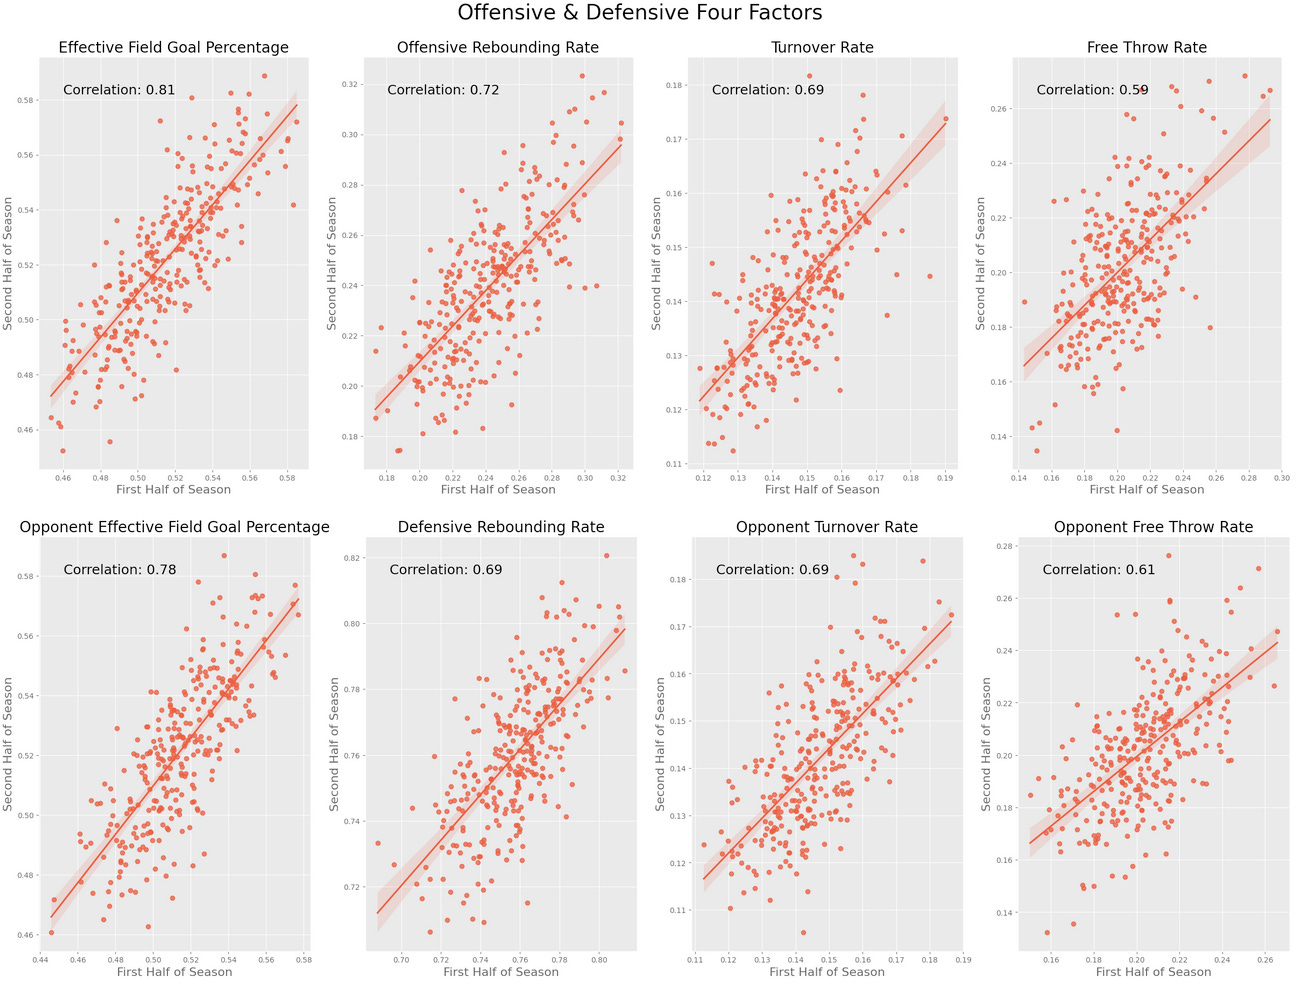
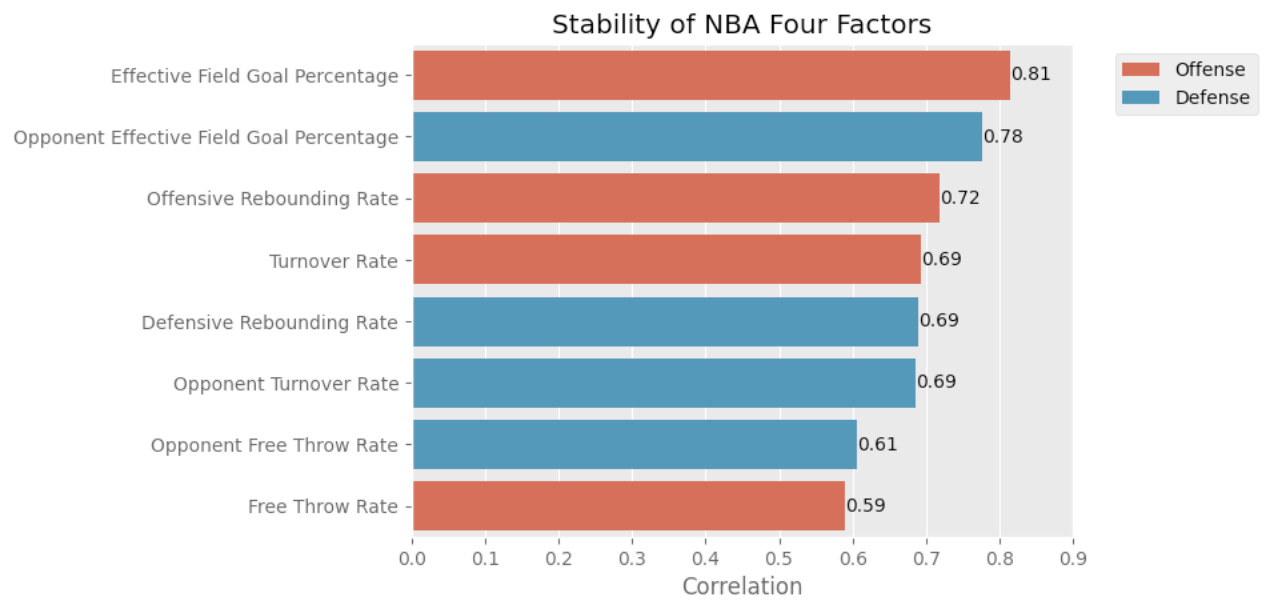
These correlations tell us that Effective Field Goal Percentage is the most stable of the four factors, both offensively and defensively. Over a period of time, this is the metric that depends most on the underlying skill of the team, rather than random variations.
Another interesting observation is that the offensive factors seem to be slightly more stable than the defensive ones. The differences aren't enormous, but the trend does seem to exist. This tracks with the conventional wisdom that offenses have more control over their own play than the defense. The only one of the Four Factors for which this isn't true is Free Throw rate. The ability to not foul the other team is more stable than the ability to draw fouls.
Translating to The Playoffs
Since most NBA fans recognize that playoff basketball is so different from the regular season, I was curious to see what that meant in terms of the Four Factors. What translates the most: a good offense, or a good defense? Using correlation like we did for the regular season isn't an appropriate measure because the playoffs are very match-up dependent. In the regular season, while there are conference and divisional differences, all teams will play each other at least twice. In contrast, half of the teams that make the playoffs in a given year will only face one opponent, and at most three. So any method we use for the playoffs should take the match-up into account.
We can use linear regression to try and predict a team's performance in playoff games as a function of both teams' regular season stats. Using Effective Field Goal Percentage as an example, I used the following model:
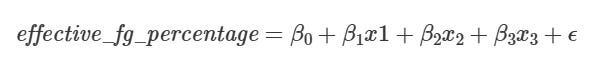
Where:
β0 is the intercept
β1, β2, and β2 are the coefficients of the following covariates
x_1: regular_season_effective_fg_percentage
x_2: opponent_regular_season_defensive_effective_fg_percentage
x_3: home_court, an indicator variable for whether or not the team in question had home court advantage
ϵ (epsilon) is a normal error term
In order to determine which covariates are contributing the most to the response variable in question, we can use Shapley decomposition of R-Squared. Essentially, it allows us to give credit to each of our predictors by measuring how much of the variance in our response variable, in this case, the Effective Field Goal Percentage in a playoff game, can be explained by that predictor.

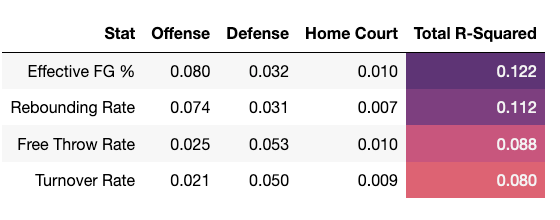
Using Shapley decomposition, we see that although we tend to place a higher importance on defense in the playoffs, it's really a mixed bag. For shooting and rebounding, the offense is a more important predictor of playoff performance than defense, while the opposite is true for turnovers and free throw rate.
Most of this is consistent with the results that we got from measuring the stability of these metrics. The one surprise is that turnovers seem to depend on the defense more than the offense. Based on their stability, we might have expected those contributions to be about the same.
We can also look at the total R-Squared to see which metrics are overall the most predictable based on regular season stats. These results are also pretty consistent with what we saw when we measured stability.
Additional Thoughts
When we measure stability by separating the seasons into halves, some of the correlations were very close. For example, it's not clear whether or not a difference of .03 means anything or not. We could account for that by using bootstrapping to take uncertainty into account. If a bootstrap yields confidence intervals that overlap significantly, that would tell us that there may not be a significant difference in stability between the two metrics.
Here, we only predicted performance on the team level. That wouldn't take into account in-season injuries or transactions. Some have used an RAPM-style approach to measure individual players' impact on the four factors. That approach could potentially give us more accurate out-of-sample predictions.