
Comparing QB Stats

If you follow the NFL, you probably have strong opinions on who should win the MVP award this season. On DraftKings, Josh Allen is currently the favorite to win the award at -300 (a 75% implied probability) with Lamar Jackson at +225 (an implied 30.8% probability). Much of the discussion has revolved around comparisons of the two quarterbacks’ stats. In this post, I won’t comment specifically about this year’s MVP race. But I would like to illuminate how I and many others in the analytics space think about QB stat comparisons.
Comparing Stats
Every sports fan knows what it’s like to scour the internet (usually sports-reference.com) for the stats to support their argument about a player. There’s even a comparison tool that makes it easy to do so. For example, here’s a comparison between two QB’s for the 2024 season (Not Allen and Jackson):
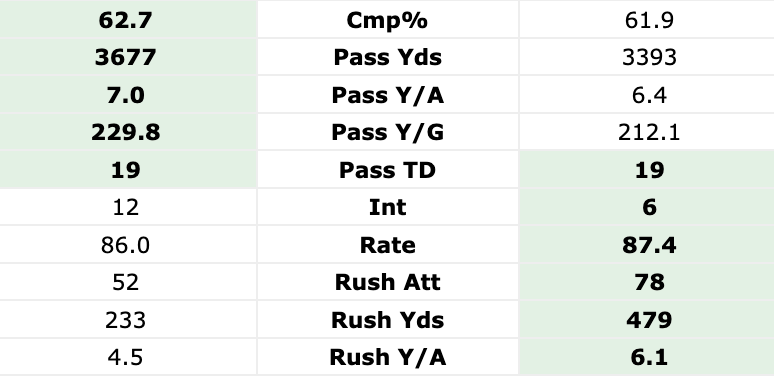
Take a second to think about which stat line is better.
This is a futile task for several reasons:
The graphic I gave you disregards sacks and fumbles, which can have a major effect on a drive.
Without some sort of framework, comparing across stats is arbitrary. How should we value 300 more passing yards and a slightly higher completion percentage vs. 6 more interceptions?
Standard stats like these throw away many of the nuances of football. Consider for example:
A QB who throws it behind the sticks on 3rd down, gaining a completion and additional yards, but failing to keep the drive alive.
An interception on a deep pass on 3rd and long, which doesn’t really hurt the team compared to an incompletion.
The game situation is important when determining how to judge these stats, but that information is lost when using counting stats.
Expected Points
Luckily there is a widely accepted framework that deals with all of these issues: Expected Points. I won’t go into detail about it here, but I recommend this explainer video from ESPN. The video is about college but the concept is the same in the NFL: We can assign a value to each play based on the down, distance, and field position (We call that value Expected Points). Then we can find the change in that value from one play to the next to measure how beneficial the play was to the offense (Expected Points Added or EPA). So for instance, a 3 yard gain on 3rd & 2 will have a much higher EPA than a 3 yard gain on 3rd & 8.
By calculating the EPA on all of a quarterback’s plays, we can now measure how well the offense did when the ball was in his hands. This allows us to account for the nuance of gains and losses relative to the game situation. It also lets us compare across stats. An interception can be translated into EPA and compared against a sack or an incompletion.
I split QB play outcomes into several categories and calculated several metrics across the 2024 season so far (through week 17):
Most of this data isn’t very surprising. But the most interesting part to me is that sacks are cumulatively the most impactful type of negative play, especially if you include sack fumbles. Of course, a single sack isn’t as bad as a single interception (interceptions have a lower EPA Per Play), but because sacks happen more often, they have more impact. A quarterback that takes a lot of sacks has the potential to hurt his team quite a bit.
On the point about sacks, some might respond that sacks are more of an offensive line stat than a quarterback stat. But sack rate tends to follow a quarterback as he changes teams/teammates more than most other metrics. Of course, sacks can’t solely be attributed to the quarterback, but this is also true of every other stat.
Comparing QBs Using EPA
The players in the comparison graphic above were C.J. Stroud (left) and Caleb Williams (right). Below are their EPA metrics for 2024:
Someone looking only at the traditional stat graphic might think that Caleb Williams has “better stats” than C.J. Stroud. But EPA suggests that the Texans have faired better than the Bears when they put the ball in their QB’s hands. Why does Stroud have a higher EPA when he’s thrown more interceptions and seemingly has less production on the ground? We can break each player’s EPA into the categories from earlier.
While Stroud has lost significantly more value on interceptions, Caleb Williams has taken sacks at a historic rate. That is reflected in his EPA lost due to sacks. But the biggest separator between the two is that C.J. Stroud has added about 50 Expected Points through his pass attempts. Even if you include the interceptions, Stroud has been more efficient through the air. Again, this is impossible to deduce from the traditional counting stats.
To be clear, while EPA can add context, much is still missing. EPA doesn’t tell us how well the offensive line blocked, how open the receivers were, or how good the defense was. All of these are forces outside of the quarterback’s control that will affect EPA. But this is also true of passing yards, completion percentage, and interceptions.
How should EPA be used?
EPA isn’t a perfect metric. In fact, there has been some analysis recently that highlights its limitations including a paper by Ryan Brill, Ron Yurko, and Abraham Wyner and a blog post by Paul Sabin. But in my view, a systematic framework that allows us to evaluate all plays is better than the traditional method of cherry picking stats to fit a narrative.
Thanks for reading. Please consider subscribing and following me on Twiter/X.